

Sales Dashboard
This analysis serves the purpose of monitoring the sales performance of your ASINs.
It proves advantageous for promptly discerning the effectiveness of your individual merchandise in terms of quantity of items ordered, shipped, and returned, as well as the generated income.
Moreover, you have the opportunity to assess the historical trajectory of product performance by comparing it to past periods and year-on-year trends.
How do you access the Sales Dashboard on Vendor Central?
- Log in to your Vendor Central account using your credentials.
- Once logged in, navigate to the “Reports” tab or a similar section.
- Click “Retail Analytics”

- Click “Sales”

Let’s explore the range of options at your disposal when accessing the sales dashboard, allowing you to customize your view and thoroughly analyze the outcomes.
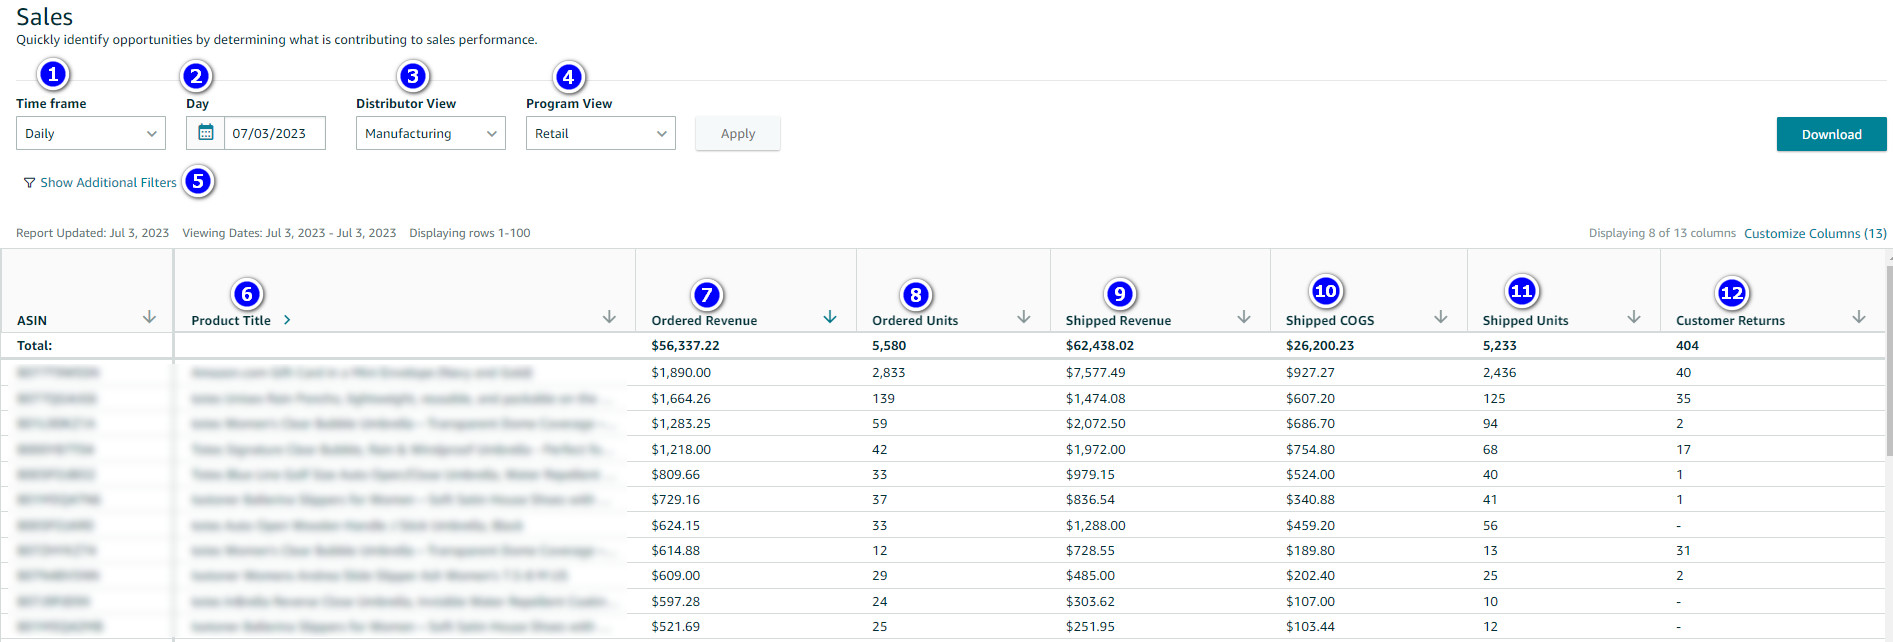
- TIME FRAME: Modify the time scale of the outcomes beneath, for instance, on a daily, weekly, or monthly basis.
- DATE SELECTOR: Depending on the chosen time frame, select the dates (days, weeks, months) to exhibit the outcomes below.
- DISTRIBUTOR VIEW: This dropdown enables you to alternate between the Sourcing perspective (accessible to all) and the Manufacturing perspective (accessible to manufacturers).
- PROGRAM VIEW: This dropdown enables you to switch between data from distinct supply chain programs (if you are enrolled in them). The Retail view is the default option accessible to everyone, and there are additional views available such as Amazon Fresh and Amazon Business.
- ADDITIONAL FILTERS: Choosing this option grants access to supplementary functions, such as searching for a specific ASIN (or multiple ASINs), and displaying its performance relative to the prior period (controlled by the time frame and date selector explained above) and year-over-year (YoY) alteration.
- SORTING: By clicking the arrow in any column, you can arrange the outcomes based on that column. For instance, when used in the Product Title column, the outcomes will be sorted in alphabetical order according to the product title. Similarly, when applied to a numerical column like Ordered Revenue, the outcomes will be sorted from highest to lowest (visible in this instance). Clicking it again will reverse the sort order.
- ORDERED REVENUE: The cumulative income resulting from customer orders within the chosen filters and timeframes, taking into account adjustments for previous transactions such as returns or cancellations, is referred to as Ordered Revenue. It is calculated by multiplying the Price by the Ordered Units
- ORDERED UNITS: This indicates the total quantity of units ordered by customers, considering adjustments for prior sales, such as returns/cancellations.
- SHIPPED REVENUE: The overall revenue generated from customer orders upon shipment is known as Shipped Revenue. It is calculated by multiplying the Price by the Shipped Units.
- SHIPPED COGS (PCOGS): Product Cost of Goods Sold (PCOGS) refers to the price paid by Amazon to you for item procurement.
- SHIPPED UNITS: This reflects the number of units dispatched to customers.
- CUSTOMER RETURNS: The count of units returned by customers.
LET’S TAKE AN EXAMPLE
Here is an actual illustration of the type of information you might seek through this dashboard.
We will examine the month-to-month progress of the two particular products to determine whether it is demonstrating improvement or not.
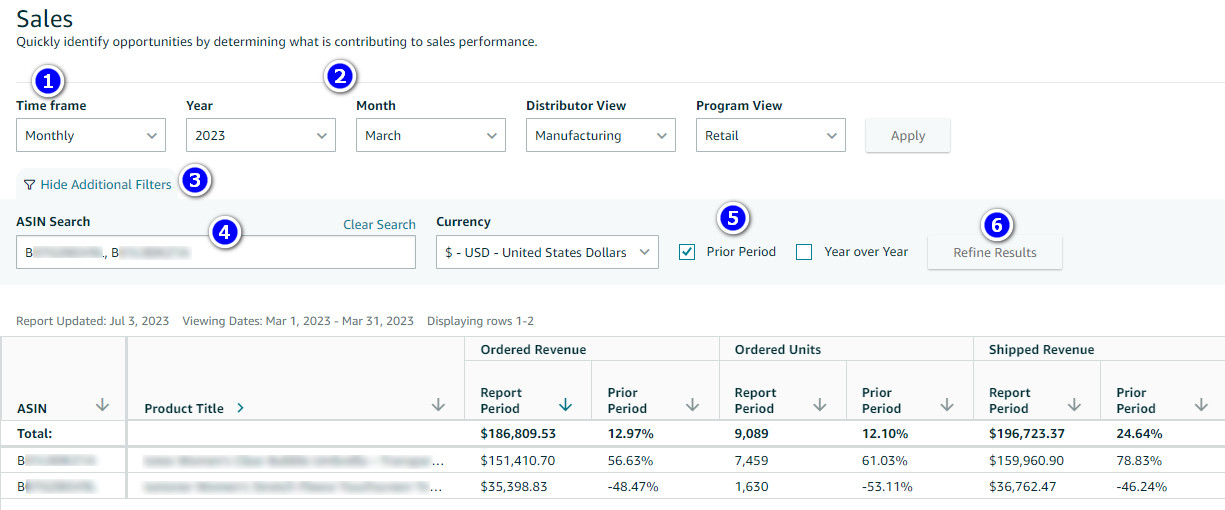
- To analyze the product’s performance over a full month, begin by adjusting the time frame to “Monthly.”
- Next, select the desired month and year.
- Access the additional filters by clicking the “Show additional filters” button.
- Enter the ASIN(s) of the desired product(s), allowing for the inclusion of multiple ASINs (up to 100).
- Enable the “Prior Period” checkbox to compare performance against the previous period.
- Finally, refine the results by clicking the “Refine Results” button.
For each column, you will find two data points displayed: the Report Period, representing the currently selected period (April 2022 in this scenario), and the Prior Period, representing the variance between the selected period and the preceding one (March 2022 in this case).
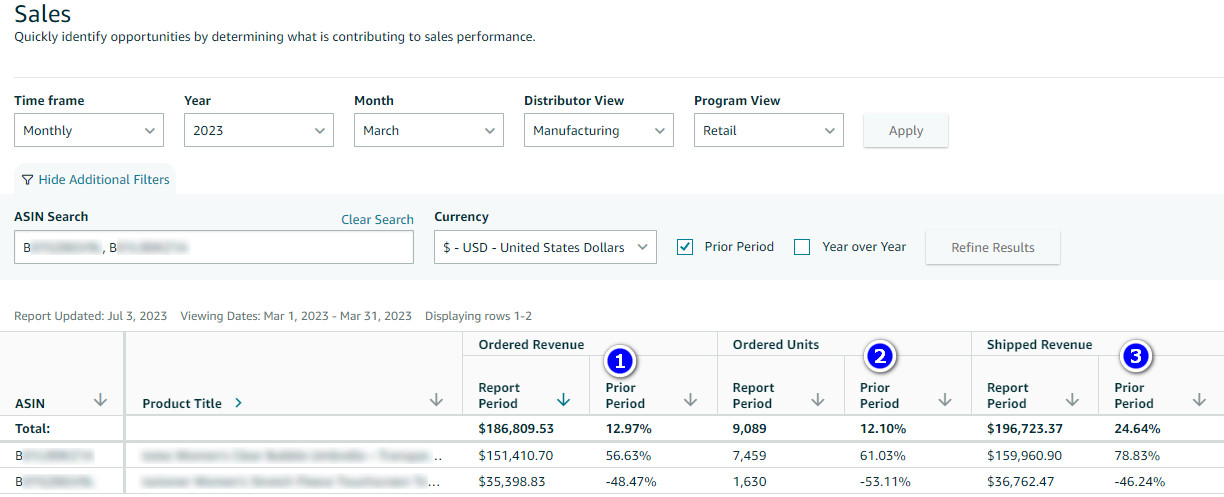
The first product’s Ordered Revenue has experienced significant month-over-month growth, increasing by 56.53%. However, the second product has seen a decrease of -48.47% in its Ordered Revenue.
Similarly, the number of Ordered Units for the first product has witnessed a growth of 61.03%, while the second product has suffered a decline of 53.11%.
Furthermore, the Shipped Revenue for the first product has shown a noteworthy increase of 78.83%. On the other hand, the second product has experienced a decline of 46.24% in its Shipped Revenue.
With StaffCloud.net by your side, you can rely on our expertise in the back office and e-commerce operations. Our dedicated team is equipped to handle various tasks including data entry, inventory management, customer support, and other administrative responsibilities. Count on us to streamline your business operations and help you achieve your organizational goals. Contact StaffCloud today and experience the difference of having a reliable partner by your side.