

Discover the power of data analysis with the Amazon Retail Analytics Traffic Dashboard. This comprehensive report allows you to delve into the number of views your ASINs receive on the Amazon website.
Glance views represent the number of views a product detail page receives from customers when you are the featured merchant. Analyzing these trends enables you to identify products with high and low traffic. By leveraging this information, you can take further steps to boost traffic, such as implementing targeted marketing activities or creating enticing promotions to convert views into increased sales.
How do you access the Traffic Dashboard on Vendor Central?
Log in to your Vendor Central account using your credentials.
Once logged in, navigate to the “Reports” tab or a similar section.
Click “Retail Analytics”
Click “Traffic”
Track Performance Over Time
In addition to real-time insights, the Traffic Dashboard enables you to review product performance over various time frames, including previous periods and year-over-year comparisons. This functionality provides a comprehensive view of your ASIN’s growth trajectory.
Customize Your Analysis
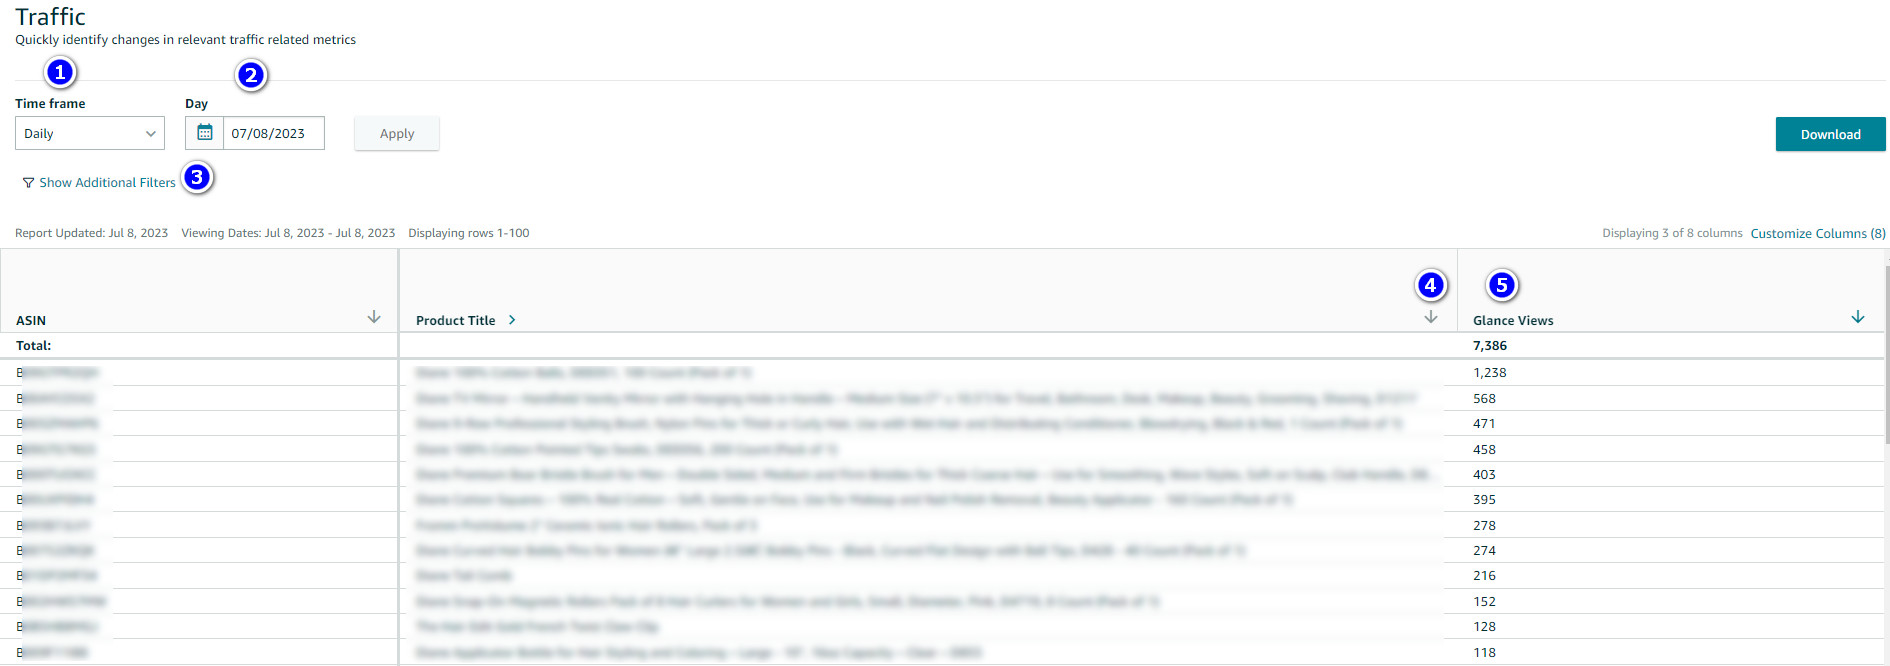
- TIME FRAME: Take control of your analysis by adjusting the time frame to suit your needs. Whether you prefer daily, weekly, monthly, or other intervals, the Traffic Dashboard accommodates your preferences.
- DATE PICKER: The Date Picker feature allows you to select specific dates, days, weeks, or months within the chosen time frame. This level of customization empowers you to focus on the exact data you require.
- ADDITIONAL FILTERS: By accessing the Additional Filters option, you can unlock advanced functionalities. Search for specific ASINs or multiple ASINs simultaneously. Compare a product’s performance with the prior period based on the selected time frame and date range. Additionally, you can observe year-over-year (YoY) changes, providing valuable insights into long-term growth.
- SORTING: Sort and organize your results effortlessly by clicking the arrow in any column. Alphabetically sort product titles or arrange numerical data, such as Glance Views, from highest to lowest. Reverse the sort order with a single click to explore data from different perspectives.
- GLANCE VIEWS: Gauge Product Page Visibility
Glance Views reflects the number of views a product detail page for a specific ASIN receives from customers on the Amazon website when you are the featured merchant. This metric unveils the level of visibility your products enjoy during the selected time frame.
A Practical Example
Explore a practical illustration of the type of information that can be uncovered through this comprehensive dashboard.
Our focus will be on evaluating the progress of two distinct products on a month-to-month basis, determining whether their performance is experiencing growth or stagnation, and identifying the contrasting factors between them.
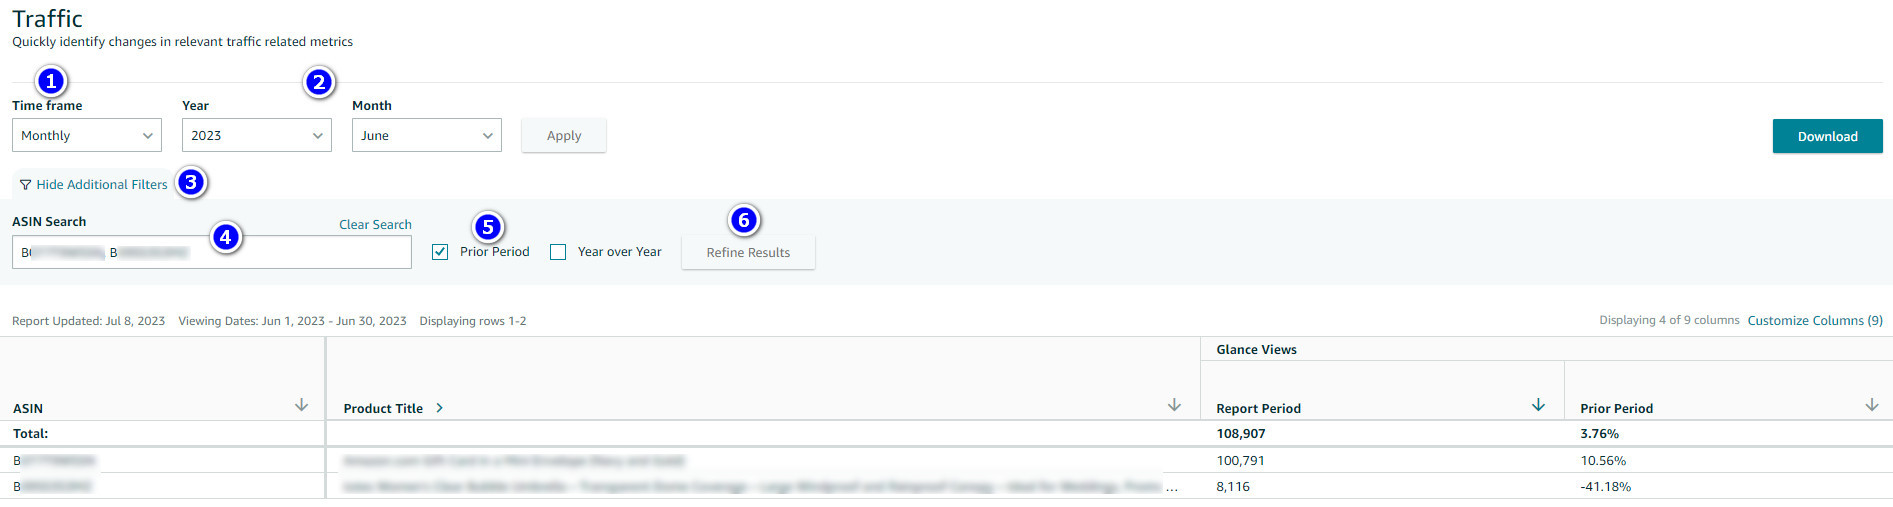
- Adjust the time frame to “Monthly” to gain insights over an entire month.
- Select the desired month and year.
- Click the “Show Additional Filters” button to unveil more options.
- Enter the ASINs of the products you wish to analyze. You can input multiple ASINs, up to a maximum of 100.
- Check the “Prior Period” checkbox.
- Click the “Refine Results” button to generate tailored insights.
Discover Key Data Points
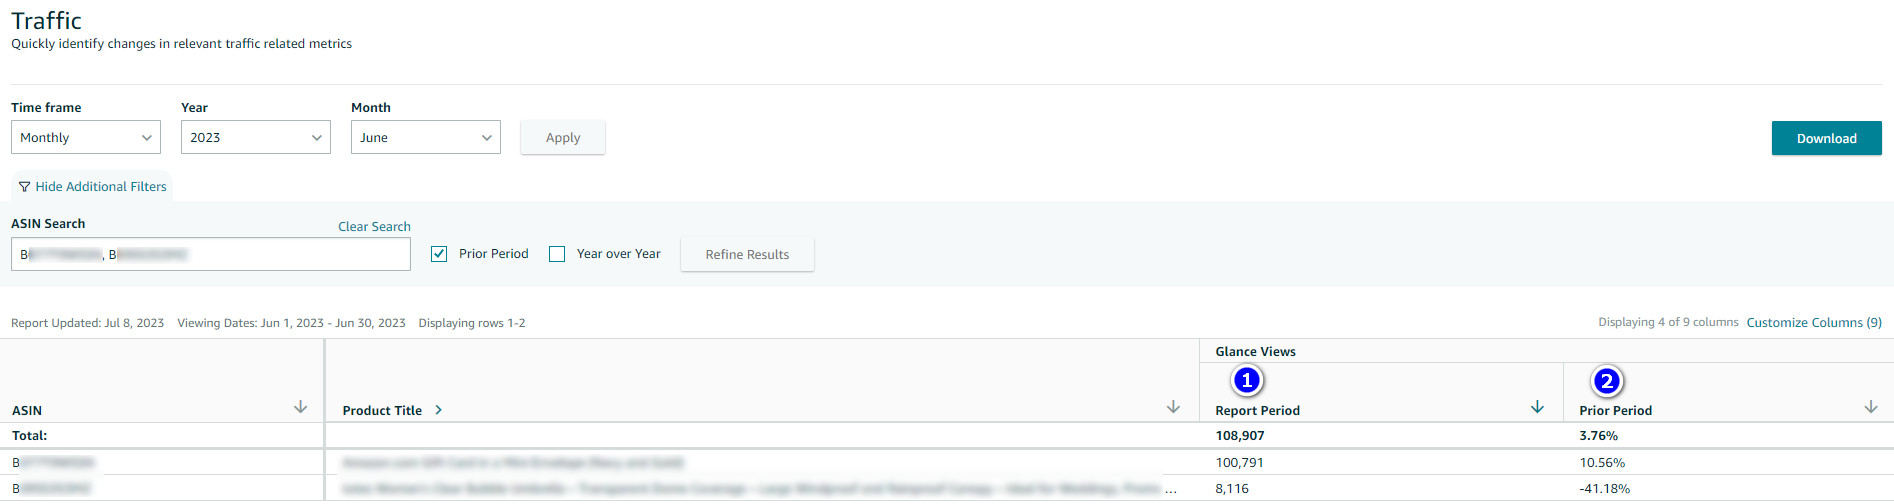
Upon refining your results, you will observe two essential data points:
REPORT PERIOD: This refers to the currently selected period, providing a snapshot of performance. For example, June 2023.
PRIOR PERIOD: This showcases the difference between the selected period and the previous one. For instance, May 2023.
Analyzing Performance
The Traffic Dashboard displays a comprehensive overview of your products’ performance. For the first product, the glance views have witnessed a significant month-over-month growth of 10.56%. Meanwhile, the second product experienced a decline of 41.18% during the same period.
Embrace the Power of Analytics
Harness the potential of Amazon Retail Analytics Traffic Dashboard to unlock vital insights about your products’ visibility and performance. By leveraging data-driven decision-making, you can make informed choices to optimize your sales and grow your business on Amazon.
Experience the difference of having a trustworthy partner by your side with StaffCloud.net. Our extensive knowledge in back-office and e-commerce operations ensures that you can depend on our expertise. Our dedicated team is proficient in handling diverse tasks, such as data entry, inventory management, customer support, and other administrative responsibilities. Trust us to optimize your business operations, bringing efficiency and aiding you in reaching your organizational objectives. Reach out to StaffCloud today and witness the transformative impact of a reliable partnership.