

Amazon Retail Analytics (ARA) is a powerful tool for vendors selling directly to Amazon. It provides vital insights into your sales, inventory, traffic, and other key performance metrics. But, understanding the various reports and how to translate them into action can be overwhelming. Let’s break down how to effectively use ARA data to optimize your Amazon business.
Key ARA Reports
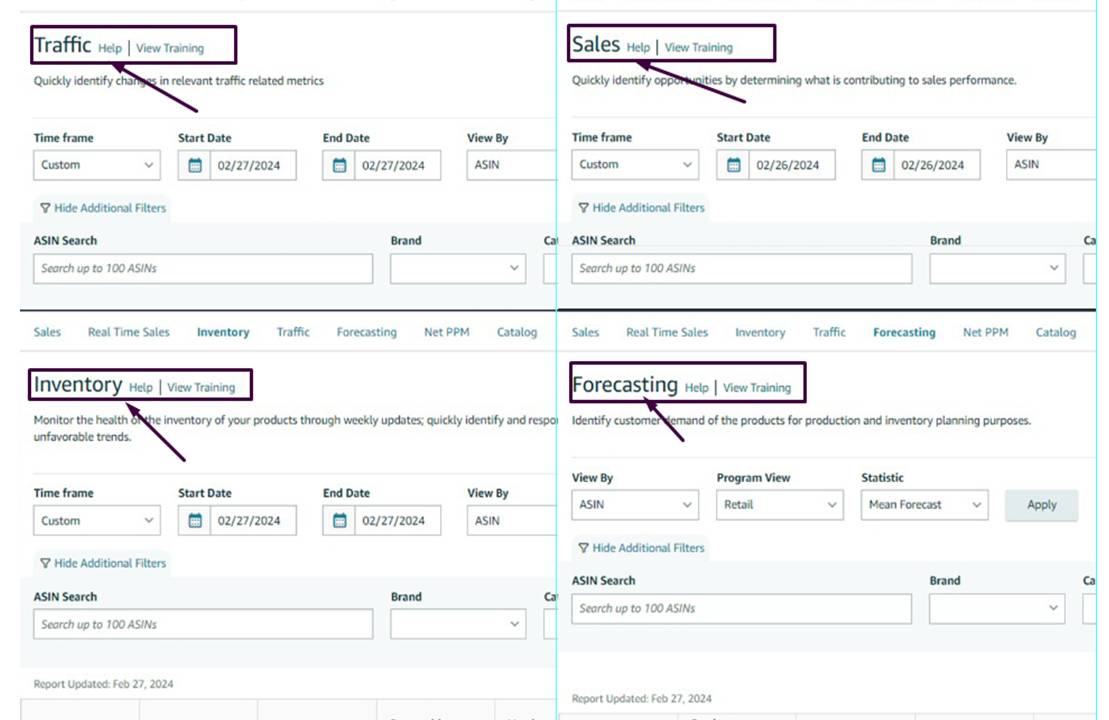
You’ll primarily focus on these reports within the ARA dashboard:
- Sales and Traffic Report: This provides an overview of your sales (units sold, revenue, conversion rate) alongside traffic data for your product listings. It helps you understand how effectively your listings convert visitors into customers.
- Inventory Performance Report: A crucial report for inventory management. It provides data on in-stock rate, potential lost sales due to out-of-stock, and inventory health to help you make restocking decisions and avoid stranded inventory.
- Demand Forecast Report: This report estimates future Amazon purchase orders based on past sales history and anticipated demand. It aids in effective inventory planning to avoid overstocking or stockouts.

Steps to Interpret ARA Data
- Define Your Goals: Before diving into the data, determine what you want to learn. Are you concerned about slow sales for a specific product? Want to improve inventory turnover? Focus your analysis on these questions.
- Choose the Right Time Frame: ARA allows you to select time periods for analysis (week, month, quarter, etc.). Choose a range that aligns with your goals and provides enough data for meaningful insights.
Key Metrics to Understand: Familiarize yourself with these essential ARA terms:
- Units Ordered: Number of units Amazon ordered from you.
- Units Shipped: Number of units you shipped to Amazon.
- Net Received: Units Amazon received and made available for sale.
- Customer Returns: Units returned by customers.
- Weeks of Cover: Estimated time to deplete current inventory based on sales rate.
- Sell-Through Rate: Percentage of inventory sold vs. what was received.
Connect the Dots (Analyze)
Analyze reports together. For example, if sales are low in the Sales and Traffic Report, check the Inventory Performance Report to see if stockouts might be the culprit. High returns might indicate product quality or listing description issues.
Look for Trends: Are specific products consistently underperforming? Are there seasonal fluctuations? Identifying patterns helps you make better long-term strategies.
ARA Data in Action
- Sales Analysis: If conversion rates are low, improve product listings (images, copy, A+ content). If traffic is low, invest in advertising or optimize keywords.
- Inventory Management: Avoid stockouts by monitoring your weeks of cover and demand forecasts. Identify overstocked items and consider promotions or liquidations.
- Forecast Optimization: Use ARA forecasts, but remember they are estimates. Factor in external events (promotions, seasonality) to refine your inventory planning.
Additional Notes
ARA data is updated regularly, so check frequently for the most up-to-date insights.
Amazon offers ARA training resources within Vendor Central for further guidance.
Sometimes data discrepancies in ARA exist. Contact Amazon support if you see potential errors.
Mastering ARA
Interpreting ARA data is a continuous process. As you become familiar with the reports and apply the insights, you’ll transform ARA into a powerful decision-making tool for your Amazon vendor business.
Need help streamlining the process of downloading the ARA data? StaffCloud.net can help you with the downloading of your reports in weekly, monthly, quarterly, and yearly formats. This saves you time and ensures you always have the most current data at your fingertips for better decision-making. Get in touch with us now, and let’s boost your Amazon presence collaboratively.