

The Amazon Retail Analytics’ Net PPM report serves as a valuable tool for evaluating Net Pure Product Margin, commonly known as Net PPM.
Net PPM goes beyond the simple revenue generated by a product, considering various expenses like cost of goods, vendor funding (co-op activities), and sales discounts. Essentially, it helps determine the actual profitability of a product from its sales, while also assessing the containment of operating and overhead costs.
Moreover, this report enables a thorough examination of a product’s performance over different periods by offering previous period and year-over-year comparisons.
How do you access the Net PPM Dashboard on Vendor Central?
- Log in to your Vendor Central account using your credentials.
- Once logged in, navigate to the “Reports” tab or a similar section.
- Click “Retail Analytics”

- Click “Net PPM”

The dashboard provides users with flexible options to customize their analyses:
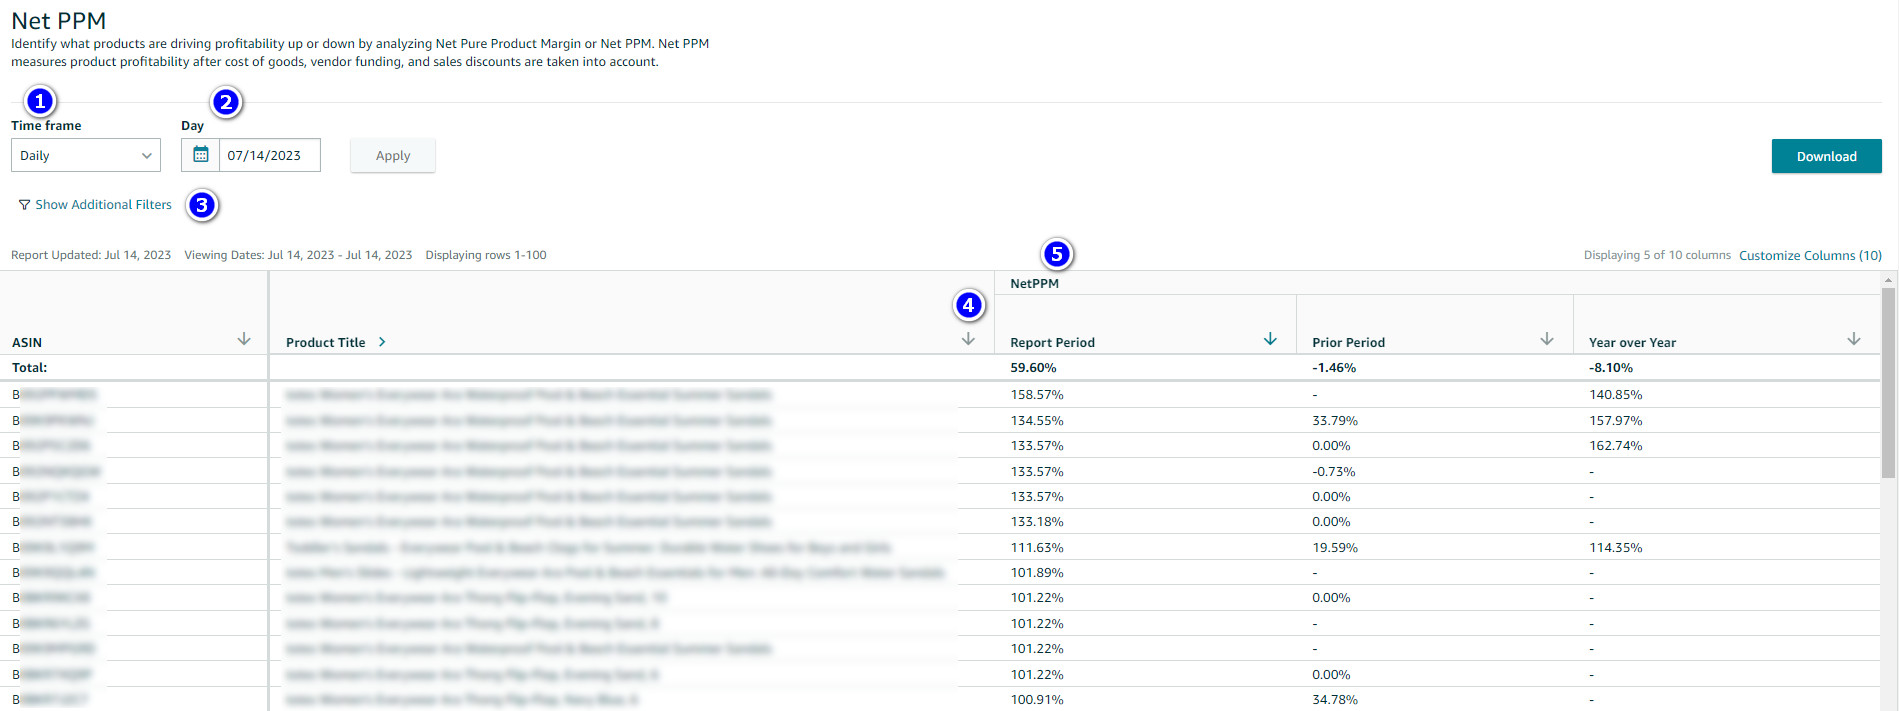
- TIME FRAME: Users can alter the time scale of the results, choosing between daily, weekly, monthly, and more.
- DATE PICKER: Depending on the chosen time frame, users can select specific dates (days, weeks, months) to display relevant results.
- ADDITIONAL FILTERS: This feature grants access to additional functions like searching for specific ASINs (Amazon Standard Identification Number) or multiple ASINs, and comparing their performance to prior periods and year-over-year changes.
- SORTING: Results can be sorted by clicking the arrow in any column. For instance, clicking on the Product Title column will sort the products alphabetically, while using the numerical column like NetPPM will sort results from the largest to the lowest.
- Net PPM: The Net Pure Product Margin for this ASIN within the chosen time frame.
An illustrative example showcases the dashboard’s practical use:
Let’s examine the month-over-month performance of two distinct products. Suppose we’ve initiated a promotional campaign on one of the products this month, aiming to increase sales despite potentially affecting profitability.
To do this:
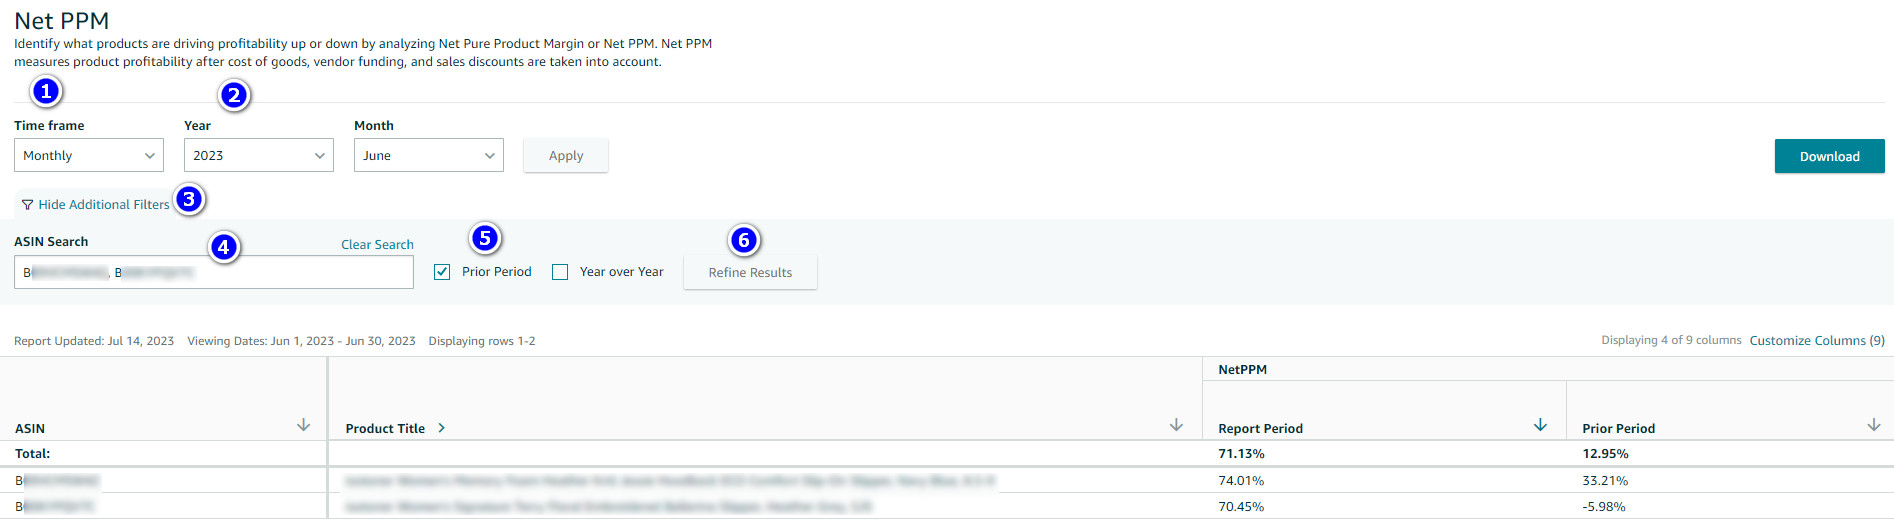
- Set the time frame to “Monthly” for an overview of the entire month’s performance.
- Select the desired month and year.
- Click “Show additional filters” to access the menu.
- Enter the ASINs of the targeted products (up to 100).
- Check the “Prior Period” checkbox.
- Click “Refine Results” to view the data.
The analysis yields two crucial data points:
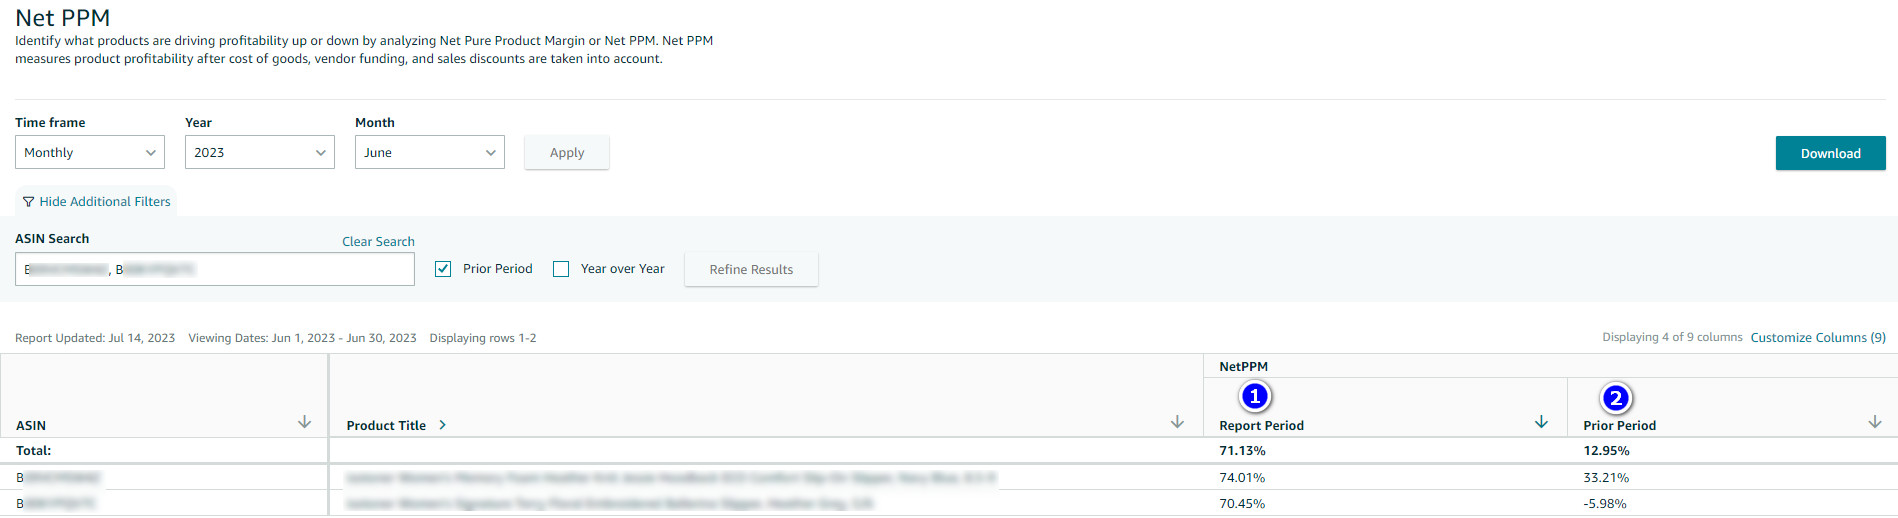
The Report Period represents the selected period (e.g., June 2023).
The Prior Period, indicates the difference between the current and previous period (e.g., May 2023).
The results reveal interesting insights: the Net PPM of the first product increased by 33.21%, while the second product’s Net PPM decreased by 5.98% due to promotional activity. Notably, both products maintained positive profitability.
It is vital to consider that Net PPM fluctuations can arise from various factors, such as changes in product costs, price adjustments due to price matching, and other market dynamics.
It’s important to bear in mind that percentage values always represent relative changes, not absolute ones. For instance, if the Net PPM for the previous month were 74.93%, the calculated difference of 5.98% would be relative to that value, resulting in a new Net PPM of 70.45% (74.93 – 5.98% = 70.45).
In conclusion, Amazon Retail Analytics’ Net PPM report provides valuable insights into product profitability by factoring in expenses. Its user-friendly dashboard allows flexible time frame adjustments and enables comparisons over different periods. The example demonstrates the impact of promotions on Net PPM. Remember, percentage differences are always relative, not absolute, and understanding context is crucial for informed decision-making. This powerful tool empowers businesses to optimize profitability and stay competitive in the market. Additionally, to gain a comprehensive perspective, it is advisable to cross-reference the findings with the Sales Dashboard and compare the volume of sales during the same time frame.
Trust StaffCloud.net for unparalleled expertise in back office and e-commerce operations. Our dedicated team excels in data entry, inventory management, customer support, and administrative tasks. Streamline your business operations and reach your organizational goals with our reliable partnership. Contact StaffCloud today for a transformative experience.