

Overview
This comprehensive report aims to track and evaluate the status of your ASIN inventory. It provides a range of metrics to offer clear insights into your inventory’s health. These metrics encompass the present availability of on-hand sellable inventory, unfulfilled customer demand, quantities of outstanding purchase orders, and the confirmation rates of your purchase orders. Moreover, the report also delivers data on compromised and unsalable units within your inventory.This comprehensive report is designed to provide a thorough assessment of your ASIN inventory’s current state, offering valuable insights into its overall performance. By utilizing a variety of metrics, the report delivers a comprehensive understanding of your inventory’s health, including the availability of sellable items, unmet customer demand, outstanding purchase orders, and purchase order confirmation rates. Additionally, the report presents data on compromised and unsalable units within your inventory, ensuring you have a complete picture of its condition.
The inventory report is a valuable tool for evaluating the operational health of your Amazon account. It provides essential information, such as which products are out of stock and which products have excessive overstock. By identifying these inventory issues, you can proactively address them and optimize your inventory management.
The Inventory dashboard provides valuable insights into your brand’s performance, such as the order confirmation rate and the volume of inventory sourced from your brand by Amazon during the specified period. By regularly monitoring your performance, you can make informed decisions about inventory allocation to Amazon, ensuring optimal efficiency and profitability.
How do you access the Inventory Dashboard on Vendor Central?
Log in to your Vendor Central account using your credentials.
Once logged in, navigate to the “Reports” tab or a similar section.
Click “Retail Analytics”
Click “Inventory”
Product Performance Analysis
Furthermore, you have the option to analyze the performance of your products over time by comparing them to prior periods and conducting year-over-year assessments.
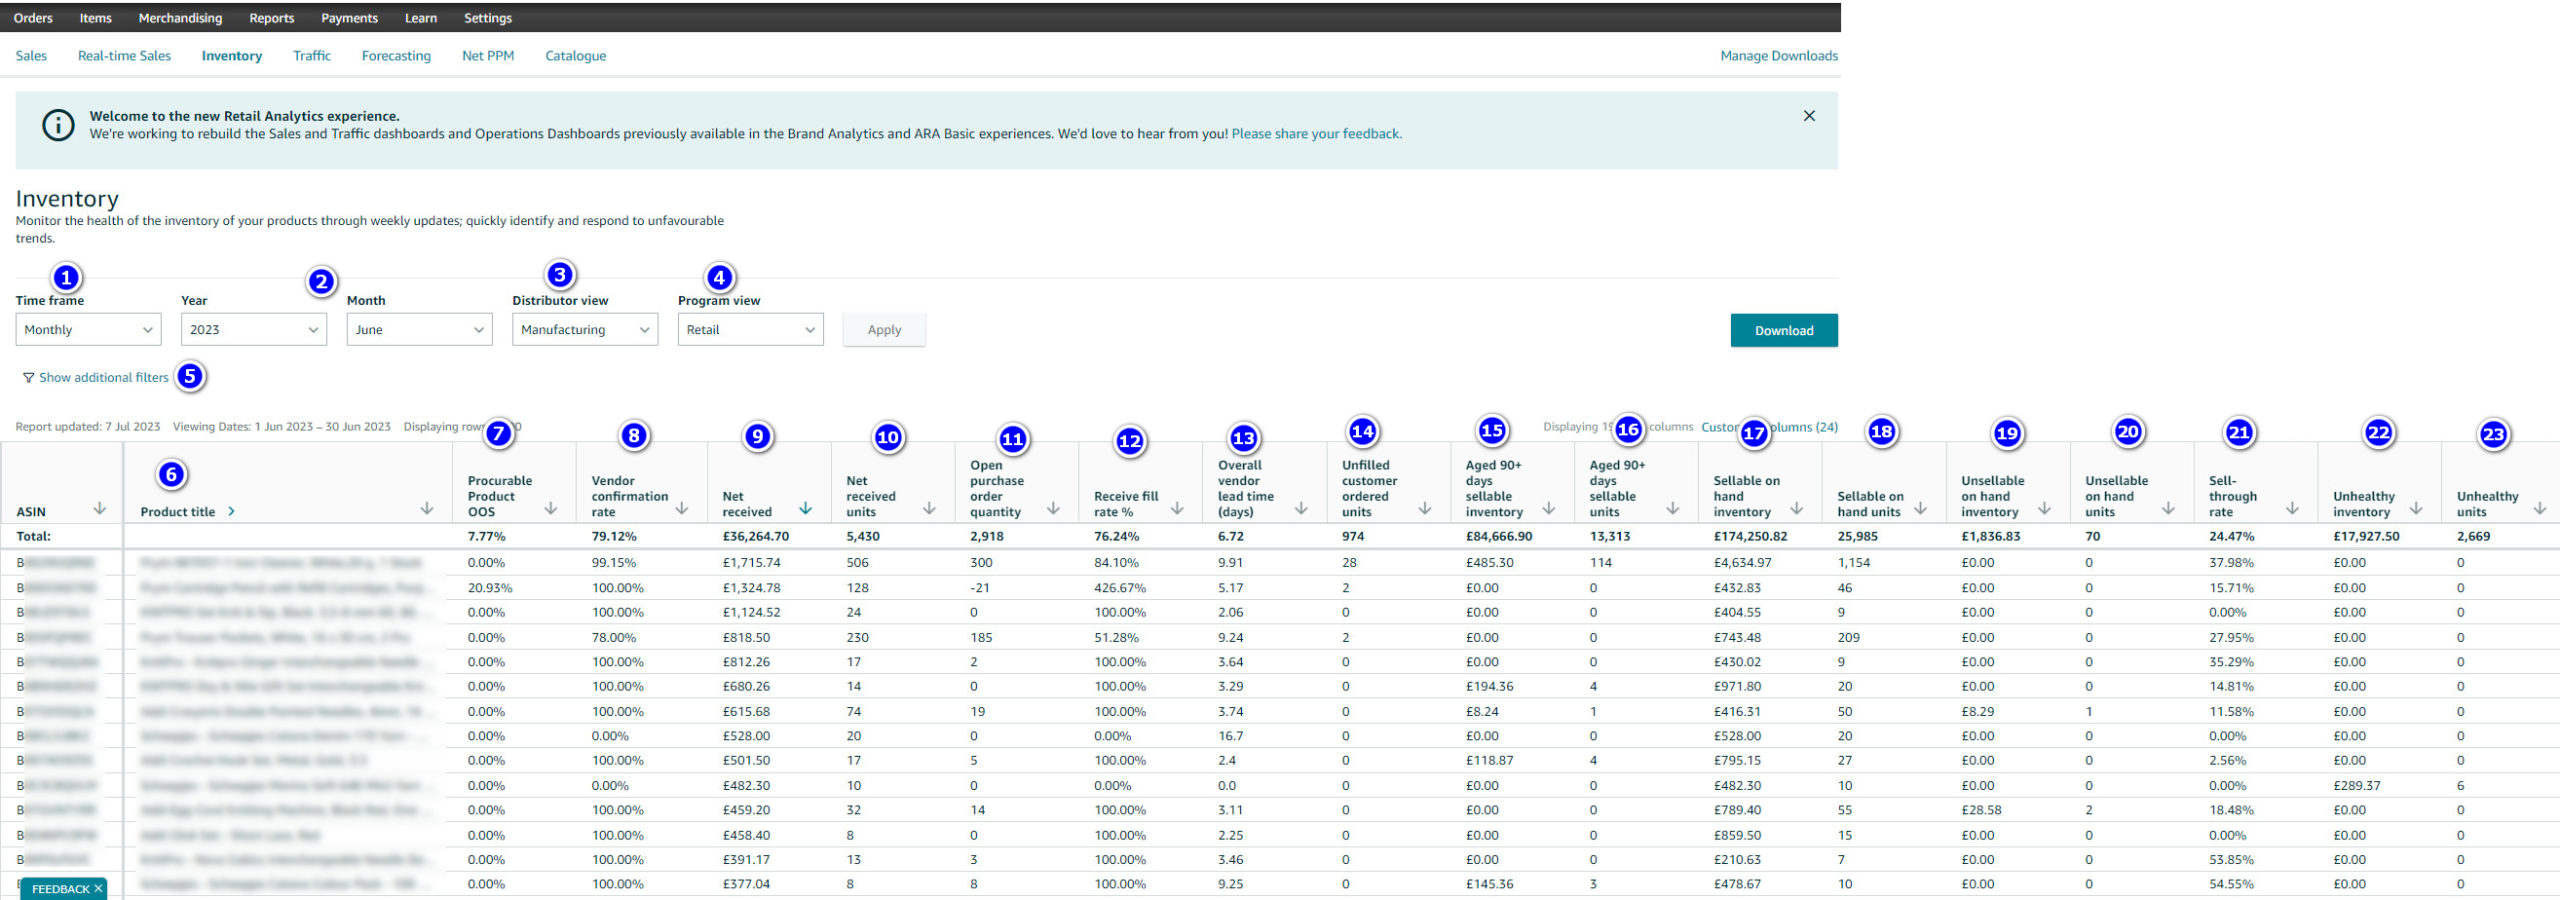
- Time Frame: You can customize the time scale of the results below to fit your needs. This allows for adjustments in the time frame to daily, weekly, monthly, or any other desired interval.
- Date Picker: Based on the selected time frame, you can manually choose specific dates (days, weeks, or months) to display the relevant results below.
- Distributor View: This drop-down menu provides the ability to switch between two distinct views: Sourcing view (accessible to all users) and Manufacturing view (exclusive to manufacturers).
- Program View: You can access data from various supply chain programs by selecting the desired option from this drop-down menu. The default view available to all users is Retail, but there are also options for Amazon Fresh and Amazon Business views.
- Additional Filters: This option grants access to additional functions that enhance the report’s capabilities. These functions include searching for specific ASINs (or multiple ASINs) and evaluating their performance relative to the prior period, taking into account the chosen time frame and date selector explained earlier. Additionally, you can observe year-over-year (YoY) changes.
- Sorting: To facilitate data analysis, you can sort the results by clicking the arrow in any column. For instance, selecting the arrow in the Product Title column will arrange the results in alphabetical order based on the product title. Similarly, choosing a numerical column like Net Received will sort the results from the largest to the smallest value (as demonstrated in this example). Clicking the arrow again will reverse the sort order.
Key Metrics
The report encompasses several vital metrics for monitoring inventory health. These metrics include:
- Procurable Product Out-of-Stock (OOS) Rate: This metric measures the frequency at which procurable products are out of stock. It indicates how many times this product was unavailable out of the total number of glance views. The glance views can be reviewed in the Traffic dashboard.
- Vendor Confirmation Rate: The Vendor Confirmation Rate represents the percentage of units confirmed by you out of the units requested by Amazon in purchase orders within the selected time frame.
- Net Received: Net Received represents the total value of units received by Amazon after deducting the amount returned to you during the selected time frame. It is calculated by multiplying the Net Received Units by the cost price.
- Net Received Units: Net Received Units indicate the total quantity of units received by Amazon after subtracting the units returned to you during the selected time frame.
- Open Purchase Order Quantity: This metric represents the quantity of units in open purchase orders, referring to confirmed quantities that are pending receipt at Amazon fulfillment centers (FCs).
- Receive Fill Rate %: The Receive Fill Rate % indicates the percentage of units received by Amazon out of the units confirmed by you in purchase orders.
- Overall Vendor Lead Time: Overall Vendor Lead Time measures the average time in days from the receipt of a purchase order to the receipt of inventory at an FC. This average is weighted based on the applied filters.
- Unfilled Customer Ordered Units: Unfilled Customer Ordered Units represent the number of customer orders (including pre-orders) that have not yet been shipped.
- Aged 90+ Days Sellable Inventory: This metric reflects the value of inventory that is at least 90 days old and remains in sellable condition until the last day of the selected time frame.
- Aged 90+ Days Sellable Units: Aged 90+ Days Sellable Units represent the quantity of units that are at least 90 days old and remain in sellable condition until the last day of the selected time frame.
- Sellable On-Hand Inventory: Sellable On-Hand Inventory represents the value of inventory stored in Amazon FCs that remains in sellable condition until the last day of the selected time frame.
- Sellable On-Hand Units: Sellable On-Hand Units indicate the number of units stored in Amazon FCs that remain in sellable condition until the last day of the selected time frame.
- Unsellable On-Hand Inventory: Unsellable On-Hand Inventory signifies the value of inventory stored in Amazon FCs that is in an unsellable condition until the last day of the selected time frame.
- Unsellable On-Hand Units: Unsellable On-Hand Units represent the number of units stored in Amazon FCs that are in an unsellable condition until the last day of the selected time frame.
- Sell-Through Rate: Sell-Through Rate is calculated by comparing the number of units shipped to customers (excluding customer returns) with the number of units available at Amazon FCs at the beginning of the selected time frame. This calculation also considers any units received during the same time period.
- Unhealthy Inventory: Unhealthy Inventory represents the value of excess inventory on the last day of the selected time frame, based on forecasted demand.
- Unhealthy Units: Unhealthy Units represent the excess inventory volume at the conclusion of the chosen time period, determined by the projected demand.
When it comes to monitoring and optimizing your inventory health, StaffCloud.net is the ideal choice. Whether it’s identifying stock shortages, managing overstock, or evaluating key performance indicators, StaffCloud.net equips you with the necessary tools to make informed decisions and enhance your inventory management. Their expertise in analyzing data and their commitment to maximizing efficiency and profitability make them a trusted partner for any Amazon seller. To benefit from their services and take your inventory management to the next level, contact StaffCloud today.